To insert a graph into a power point first you must make the graph in Excel.
1) Open excel- don't try to use the "insert chart" function
2) Type out the data EXACTLY as it appears in the question
3) Highlight Only the data you need this can include titles/labels
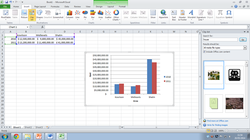
4)Go to INSERT
5)Select the type of chart you need (usually a column or pie chart)
1) Open excel- don't try to use the "insert chart" function
2) Type out the data EXACTLY as it appears in the question
3) Highlight Only the data you need this can include titles/labels
4)Go to INSERT
5)Select the type of chart you need (usually a column or pie chart)
 RSS Feed
